Pool season · State index
Florida Pool Season 2026: Opening & Closing Dates by City
Last updated: July 25, 2026 · 64 cities covered
Both halves of the pool year for all 64 covered Florida cities. The median calendar runs January 24 to December 30; 45 cities skip closing altogether. Every row links to a one-page season overview with the live water-temperature model; the opening and closing hubs carry the full checklists.
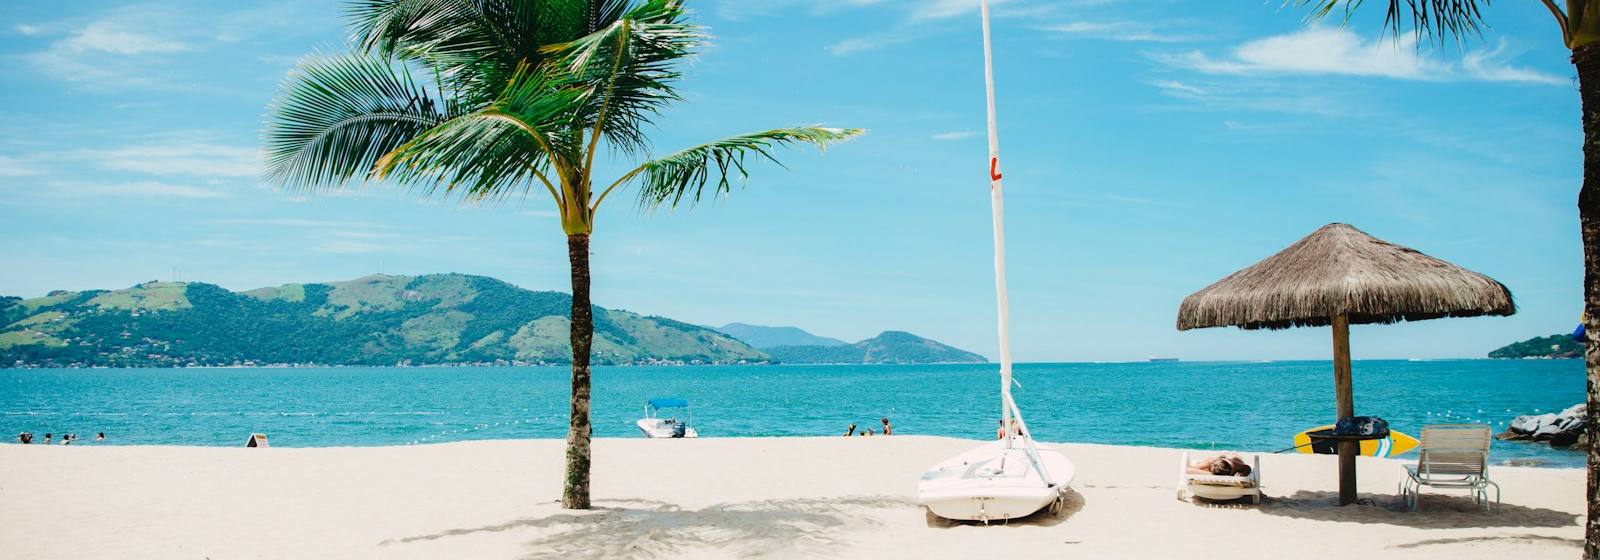 Florida: a year round-season pool state
| City | Open by | Close by | 80°F+ days |
|---|---|---|---|
| Alafaya | year-round | — | 222 |
| Boca Raton | year-round | — | 258 |
| Bonita Springs | year-round | — | 252 |
| Boynton Beach | year-round | — | 235 |
| Brandon | year-round | — | 262 |
| Cape Coral | year-round | — | 266 |
| Clearwater | year-round | — | 211 |
| Coral Springs | year-round | — | 258 |
| Davie | year-round | — | 243 |
| Daytona Beach | Jan 29 | Dec 30 | 196 |
| Deerfield Beach | year-round | — | 258 |
| Delray Beach | year-round | — | 235 |
| Deltona | Jan 24 | Dec 31 | 214 |
| Doral | year-round | — | 265 |
| Fort Lauderdale | year-round | — | 259 |
| Fort Myers | year-round | — | 266 |
| Gainesville | Feb 19 | Nov 25 | 199 |
| Hialeah | year-round | — | 276 |
| Hollywood | year-round | — | 241 |
| Homestead | year-round | — | 292 |
| Horizon West | Jan 21 | Dec 31 | 227 |
| Jacksonville | Feb 9 | Dec 12 | 193 |
| Kendall | year-round | — | 291 |
| Kissimmee | Jan 19 | Dec 30 | 224 |
| Lakeland | year-round | — | 244 |
| Largo | year-round | — | 211 |
| Lauderhill | year-round | — | 260 |
| Leesburg | Jan 21 | Dec 31 | 216 |
| Lehigh Acres | year-round | — | 252 |
| Melbourne | year-round | — | 219 |
| Miami | year-round | — | 203 |
| Miami Beach | year-round | — | 203 |
| Miami Gardens | year-round | — | 237 |
| Miramar | year-round | — | 276 |
| North Port | year-round | — | 258 |
| Ocala | Feb 1 | Dec 5 | 224 |
| Orlando | year-round | — | 227 |
| Palm Bay | year-round | — | 227 |
| Palm Coast | Feb 7 | Dec 24 | 177 |
| Panama City | Feb 24 | Nov 27 | 185 |
| Pembroke Pines | year-round | — | 279 |
| Pensacola | Feb 23 | Nov 26 | 177 |
| Pine Hills | Jan 21 | Dec 31 | 227 |
| Plantation | year-round | — | 243 |
| Poinciana | Jan 19 | Dec 30 | 224 |
| Pompano Beach | year-round | — | 258 |
| Port Charlotte | year-round | — | 291 |
| Port St. Lucie | year-round | — | 212 |
| Riverview | year-round | — | 223 |
| Sebring | year-round | — | 242 |
| Spring Hill | Jan 21 | Dec 25 | 230 |
| St. Augustine | Feb 9 | Dec 20 | 191 |
| St. Cloud | Jan 19 | Dec 30 | 224 |
| St. Petersburg | year-round | — | 210 |
| Sunrise | year-round | — | 243 |
| Tallahassee | Feb 28 | Nov 14 | 190 |
| Tamarac | year-round | — | 258 |
| Tampa | year-round | — | 223 |
| The Villages | Jan 21 | Dec 31 | 216 |
| Town 'n' Country | year-round | — | 223 |
| Wesley Chapel | Jan 20 | Dec 31 | 212 |
| West Palm Beach | year-round | — | 235 |
| Weston | year-round | — | 279 |
| Winter Haven | year-round | — | 233 |
What the columns mean
"Open by" is the recommended spring date — two weeks before the city's 7-day mean temperature crosses 61°F, the model's proxy for water approaching the 65°F algae-growth zone. "Close by" is the fall deadline — ten days after the water leaves that zone, capped a week ahead of the local 50% first-freeze date. "80°F+ days" counts days whose normal high reaches 80°F: the length of the true warm-swim season, and the fairest single number for comparing Florida cities against each other.
Every figure comes from each city's own NOAA 1991–2020 normals station (named in its guide's footer), so neighboring cities can legitimately differ by a few days. The season overview linked from each row adds the live water-temperature model and the full-year season bar; the state hubs above carry the step-by-step checklists.
Swim-season length across Florida
The fairest way to compare Florida cities is the number of days with 80°F+ normal highs — the practical warm-swim season. Every bar links to that city's one-page season overview with the live water model.
Florida pool climate at a glance
Subtropical to tropical warmth keeps many Florida pools open year-round, especially in the south, though hurricane season and daily summer thunderstorms demand weather-aware maintenance. In model terms that makes Florida a year-round-season state. The spread shows up clearly on the local pages: compare Homestead's pool season with Spring Hill's and the difference is measured in weeks, not days. Neighbors in the index run on their own normals too — see District of Columbia and Georgia for the adjacent calendars.
Florida pool season FAQ
When do pools open in Florida?
Model openings in Florida run from January 19 in Kissimmee to February 28 in Tallahassee, with the statewide median on January 24. Each date is two weeks before that city's 7-day mean temperature crosses 61°F — early enough to start up in algae-cold water.
When should you close a pool in Florida?
The median Florida closing deadline is December 30, and every city's own deadline is capped a week ahead of its NOAA 50% first-freeze date. Closing late and cold beats closing early and warm — cool water holds its winter chemistry far better.
Which Florida city has the longest swim season?
Homestead leads with 292 days of 80°F+ highs per year, while Pensacola brings up the rear at 177 days. The chart above ranks every covered city by the same metric.